MTA Subway Stations and Entrances

This project displays all of the MTA Stations and entrances provided by the NYC Database. The data is used to connect the stations by creating the Subway lines that run through each station.
Overview:
For this project, after acquiring the NYC Database data on MTA Stations and Entrances in a .csv format, I extracted the needed information such as the latitude and longitude values of all of the stations and entrances in order to display them on a map of NYC. In order to extract the latitude and longitude values, I used an SQL search after importing the databases. After preparing the data for use, I used the help of the folium library in order to plot all of the points on the map. Once all of the stations were plotted on the map, I used their global locations in order to connect each station to each other through the Subway lines that run through them.
Data:
Click on the following link to see the results of the project: OPEN
After going through the original NYC Database .csv file and applying functions to export the data, the resulting data was extracted: stations.csv and entrances.csv. These two DataFrames were used to plot the stations and entrances on a folium map.
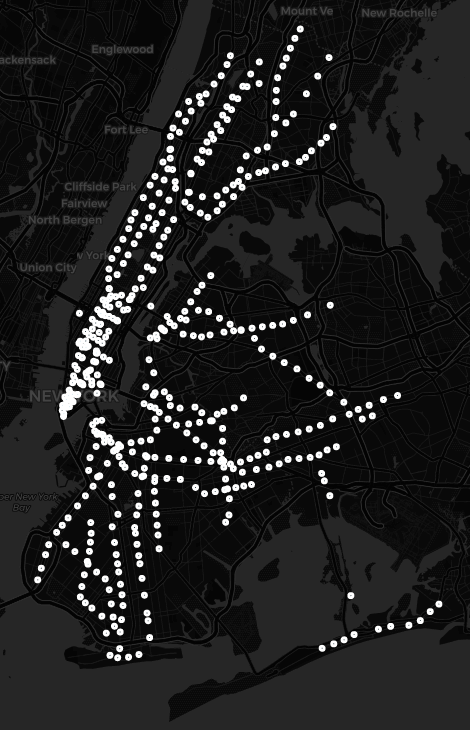
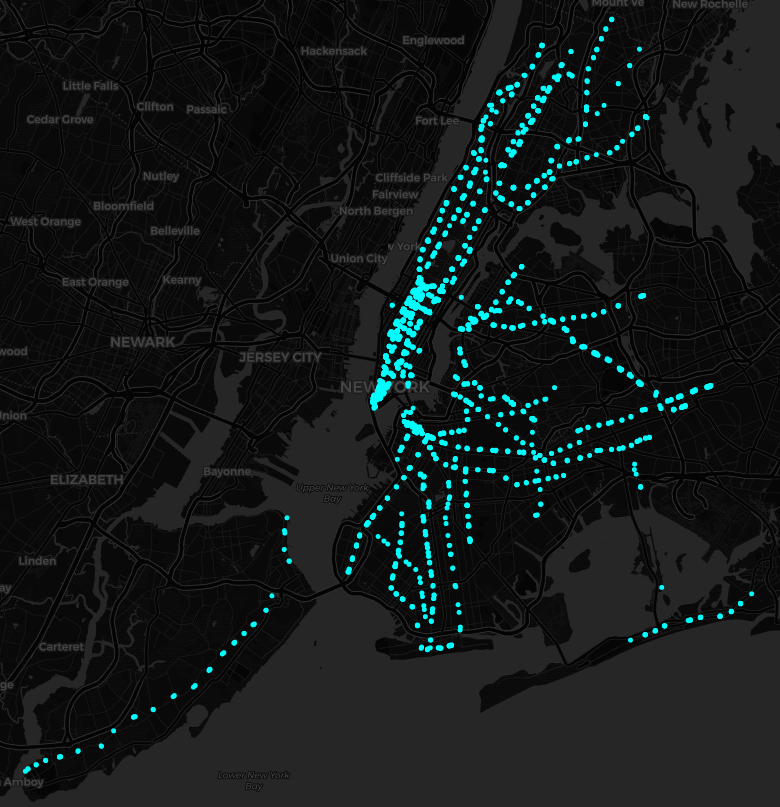
To have clickable stations and entrances, the entrances were plotted second, in order to not have the station circle covering the entrance circles and blocking them from being clicked and displaying information.
Images:


- White circles represent MTA Subway Stations
- Can be clicked on to show the name of the Subway station and all of the Subway lines that pass through the station
- Cyan circles represent MTA Subway Entrances
- Can be clicked on to show the name of Subway entrance and all of the Subway lines that pass through the station
- Colored lines represent MTA Subway lines, such as the A, D, R, or L
- The color of the line represents the color of MTA Subway line
- Can be hovered over to show the name of the line
Latitude and Longitude values of every station for every line:
In order to achieve lines being drawn on the map such as this:

I had to clean up the data several times. In its raw form, after extracting the Subway stations from the original database and drawing the Subway lines, the resulting line would look like this:
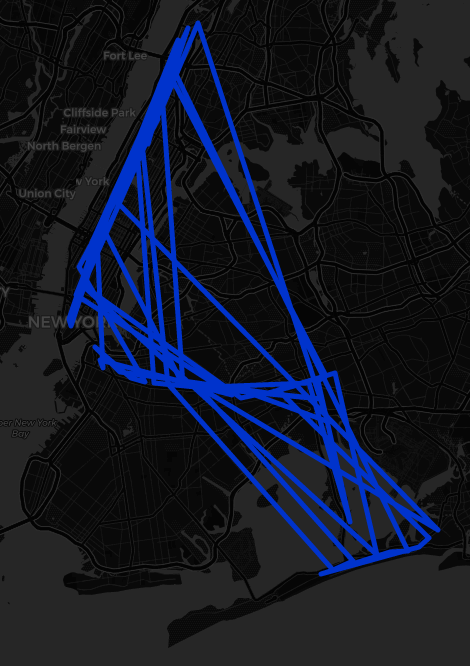
After applying the sort() function on the DataFrame, the A line in this case would look like this:
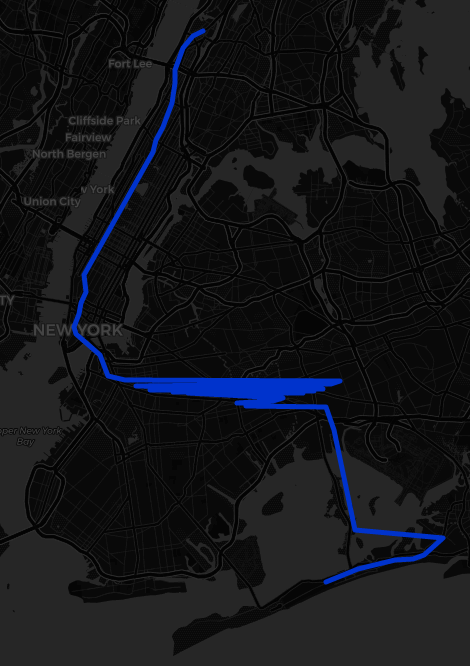
To finally achieve the final product, I had to manipulate the order of the latitude and longitude values in the .csv file of that line to be in the right order, resulting in a correct line representation.
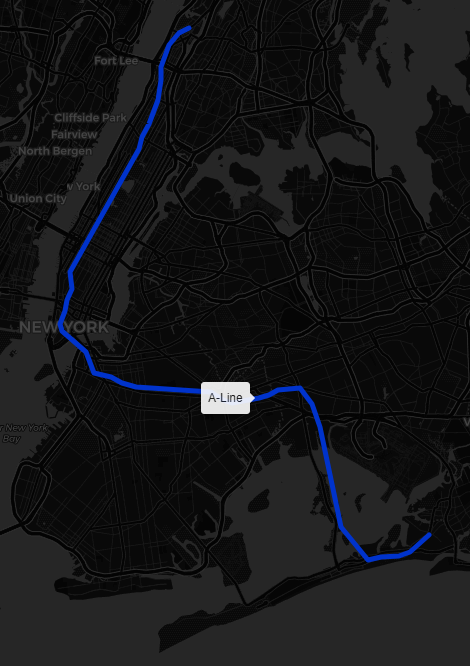
The .csv files below represent all of the stations that a Subway line would go through throughout its route after editing and sorting so that they would be in the right order and accurate to the MTA Subway lines’ route.
- 1 Line
- 2 Line
- 3 Line
- 4 Line
- 5 Line
- 6 Line
- A Line
- B Line
- C Line
- D Line
- E Line
- F Line
- G Line
- J Line
- L Line
- M Line
- N Line
- Q Line
- R Line
- S Line
- S Line
- W Line
- Z Line
Techniques:
After downloading the data from the Database, the main column for this project was labeled as “the_geom” and contained data in a format such as this “POINT (-73.99106999861966 40.73005400028978)”. In order to make the data suitable to my needs, I created the functions clean() and cleanEntrances() which would turn the data given in “the_geom” in both database .csv files into two dataframes: stations.csv and entrances.csv.
After gathering the stations and entrances data, next, I had to gather the data for the Subway Lines. To have clean and accurate lines of the Subway line route, I had to create a separate .csv file for each line from 1-7 lines and from A-Z lines. I started this process by going through each one by one. At first, the stations that have a Subway line like the ‘D train’ pass through them were appended in an empty array. The data was then sent through a sort() method, which would order the rows in the data from lowest to highest in order to reduce the workload needed to accurately order all of the stations. Once the sort() method was applied, the data was then extracted into an external .csv file and manipulated to have the stations in the right order and to have an accurate representation of the real route that specific Subway line takes.
After the Subway line data is put in the correct data, it is imported back into the code file and sent through a formatting function makePoints(variableName), which would format the data in a way which will be accepted by folium’s PolyLine.
Once all of the needed data was gathered, I initialized the folium map which was centered at (40.73918819124564, -73.9493588415071), the coordinates of NYC, zoom was set at 11 in order to capture all of the plotted data in one view, and the tile was set to cartodbdark_matter, which shows a map of the dark version of NYC in order to bring all of the focus on the stations, entrances, and lines drawn on the map.
To have all of the Subway lines displayed on one map together, all of the lines have to be imported and formatted before being sent to PolyLine. PolyLine then processes the data given and after adding configuration adds the lines the initial folium map initialization.
After drawing the lines, all of the Subway stations and entrances are drawn on top of the lines by placing folium.Circle markers on the given latitude and longitude values of every station and entrance. Once all of the configurations, such as radius and color are set, the folium map is then finally saved into an .html file which can be opened in a browser.
Citations:
Databases:
https://data.cityofnewyork.us/Transportation/Subway-Stations/arq3-7z49
https://data.cityofnewyork.us/Transportation/Subway-Entrances/drex-xx56
Resources:
https://python-visualization.github.io/folium/quickstart.html
https://autogis-site.readthedocs.io/en/latest/notebooks/L5/02_interactive-map-folium.html
https://python-visualization.github.io/folium/modules.html
https://deparkes.co.uk/2016/06/03/plot-lines-in-folium/
Code:
import pandas as pd
import pandasql as psql
import folium

def clean(df): #Used to extract the latitude and longitude values from the Stations .csv file
    x = []
    for i in df["Stations"]:
        temp = i.split(' ')
        lat = temp[1][1:]
        lon = temp[2][0:-1]
        x.append([lat,lon])
    for i in x:
        i = list((map(float, i)))
    z = pd.DataFrame(data=x,columns=["lat","lon"])
    return z

def cleanEntrances(df): #Used to extract the latitude and longitude values from the Entrances .csv file
    x = []
    for i in df["Entrances"]:
        temp = i.split(' ')
        lat = temp[1][1:]
        lon = temp[2][0:-1]
        x.append((lat,lon))
    for i in x:
        i = list((map(float, i)))
    z = pd.DataFrame(data=x,columns=["lat","lon"])
    return z

def makePoints(df): #Used to format the latitude and longitude points to be used to plot PolyLine for each MTA Line
    data = []
    for i in df.index:
        lon = float(df['0'][i])
        lat = float(df['1'][i])
        data.append([lon,lat])
    return data

file1 = "SUBWAY_STATIONS.csv" #Import .csv file
file2 = "SUBWAY_ENTRANCES.csv" #Import .csv file

stations = pd.read_csv(file1) #Read imported .csv file
entrances = pd.read_csv(file2) #Read imported .csv file

a = 'SELECT "the_geom" as Stations FROM stations'
b=psql.sqldf(a)

c = 'SELECT "the_geom" as Entrances FROM entrances'
d=psql.sqldf(c)

dfStations = clean(b) #Store the latitude and longitude points of MTA stations returned by the function
dfEntrances = cleanEntrances(d) #Store the latitude and longitude points of MTA station entrances returned by the function


m = folium.Map(location=[40.73918819124564, -73.9493588415071],
                                                               zoom_start=11,
                                                               tiles='cartodbdark_matter') #Create the folium map centered on NYC with a 'cartodbark_matter' tile style in order to distinguish MTA lines more clearly
#stamenwatercolor OpenStreetMap


""" #Method used to extract the latitude and longitude points of stations that a MTA Subway Line passes through in order to extract the points into a separate .csv file dedicated to that line.
BBB = []
for i in stations.index:
    lon = float(dfStations['lon'][i])
    lat = float(dfStations['lat'][i])
    if '7' in stations['LINE'][i]: #For example, this line would append all the latitude and longitude points of stations that have a 7 line passing through it.
        BBB.append([lon,lat]) #The point is then stored in a variable, which is then sorted and exported.

BBB.sort()
"""


f = pd.read_csv("FLine.csv") #Gets the points needed for the PolyLine of the F train line
pointsF = makePoints(f) #Formats and saves the points in a way that can be read by PolyLine

b = pd.read_csv("BLine.csv")
pointsB = makePoints(b)

q = pd.read_csv("QLine.csv")
pointsQ = makePoints(q)

r = pd.read_csv("RLine.csv")
pointsR = makePoints(r)

w = pd.read_csv("WLine.csv")
pointsW = makePoints(w)

a = pd.read_csv("ALine.csv")
pointsA = makePoints(a)

c = pd.read_csv("CLine.csv")
pointsC = makePoints(c)

d = pd.read_csv("DLine.csv")
pointsD = makePoints(d)

e = pd.read_csv("ELine.csv")
pointsE = makePoints(e)

g = pd.read_csv("GLine.csv")
pointsG = makePoints(g)

j = pd.read_csv("JLine.csv")
pointsJ = makePoints(j)

n = pd.read_csv("NLine.csv")
pointsN = makePoints(n)

l = pd.read_csv("LLine.csv")
pointsL = makePoints(l)

mm = pd.read_csv("MLine.csv")
pointsM = makePoints(mm)

z = pd.read_csv("ZLine.csv")
pointsZ = makePoints(z)

s1 = pd.read_csv("SLine1.csv")
pointsS1 = makePoints(s1)

s2 = pd.read_csv("SLine2.csv")
pointsS2 = makePoints(s2)

l1 = pd.read_csv("1Line.csv")
points1 = makePoints(l1)

l2 = pd.read_csv("2Line.csv")
points2 = makePoints(l2)

l3 = pd.read_csv("3Line.csv")
points3 = makePoints(l3)

l4 = pd.read_csv("4Line.csv")
points4 = makePoints(l4)

l5 = pd.read_csv("5Line.csv")
points5 = makePoints(l5)

l6 = pd.read_csv("6Line.csv")
points6 = makePoints(l6)

l7 = pd.read_csv("7Line.csv")
points7 = makePoints(l7)


#PolyLine uses the points provided to create a line between every 2 points
folium.PolyLine(pointsA,color = '#0033cc',weight=5,tooltip='A-Line').add_to(m) #creates a PolyLine, which is a bunch of lines connecting 2 points that consist of latitude and longitude values
folium.PolyLine(pointsB,color = '#cc6600',weight=5,tooltip='B-Line').add_to(m) #The color is set to #cc6600 which is meant to represent the color used for that specific Subway Line
folium.PolyLine(pointsC,color = '#0033cc',weight=5,tooltip='C-Line').add_to(m) #The weight represents the thickness of the line.
folium.PolyLine(pointsD,color = '#cc6600',weight=5,tooltip='D-Line').add_to(m) #The tooltip is the message that will display when hovering over any line that make up the PolyLine
folium.PolyLine(pointsE,color = '#0033cc',weight=5,tooltip='E-Line').add_to(m)
folium.PolyLine(pointsF,color = '#cc6600',weight=5,tooltip='F-Line').add_to(m)
folium.PolyLine(pointsG,color = '#009933',weight=5,tooltip='G-Line').add_to(m)
folium.PolyLine(pointsJ,color = '#996633',weight=5,tooltip='J-Line').add_to(m)
folium.PolyLine(pointsL,color = '#737373',weight=5,tooltip='L-Line').add_to(m)
folium.PolyLine(pointsM,color = '#cc6600',weight=5,tooltip='M-Line').add_to(m)
folium.PolyLine(pointsN,color = '#ffcc00',weight=5,tooltip='N-Line').add_to(m)
folium.PolyLine(pointsQ,color = '#ffcc00',weight=5,tooltip='Q-Line').add_to(m)
folium.PolyLine(pointsR,color = '#ffcc00',weight=5,tooltip='R-Line').add_to(m)
folium.PolyLine(pointsS2,color = '#737373',weight=5,tooltip='S-Line').add_to(m)
folium.PolyLine(pointsS1,color = '#737373',weight=5,tooltip='S-Line').add_to(m)
folium.PolyLine(pointsW,color = '#ffcc00',weight=5,tooltip='W-Line').add_to(m)
folium.PolyLine(pointsZ,color = '#996633',weight=5,tooltip='Z-Line').add_to(m)

folium.PolyLine(points1,color = '#ff0000',weight=5,tooltip='1-Line').add_to(m)
folium.PolyLine(points2,color = '#ff0000',weight=5,tooltip='2-Line').add_to(m)
folium.PolyLine(points3,color = '#ff0000',weight=5,tooltip='3-Line').add_to(m)
folium.PolyLine(points4,color = '#009933',weight=5,tooltip='4-Line').add_to(m)
folium.PolyLine(points5,color = '#009933',weight=5,tooltip='5-Line').add_to(m)
folium.PolyLine(points6,color = '#009933',weight=5,tooltip='6-Line').add_to(m)
folium.PolyLine(points7,color = '#aa00ff',weight=5,tooltip='7-Line').add_to(m)


for i in dfStations.index: #For loop creates a circle marker at every stations' location
    lat = dfStations['lat'][i]
    lon = dfStations['lon'][i]

    folium.Circle((lon, lat),
                  popup=stations['NAME'][i] +  " Line(s): " + stations['LINE'][i],
                  radius=100,
                  color="white",
                  fill=True,
                  fill_color="#1e81b0").add_to(m)
    #clicking on the circle displays a popup with the name of the station and all of the lines that pass through it

for i in dfEntrances.index: #For loop to create a smaller circle around every entrance
    lat = dfEntrances['lat'][i]
    lon = dfEntrances['lon'][i]
    name = str(entrances['NAME'][i])
    entrance = str(entrances['LINE'][i])
    folium.Circle((lon, lat),
              radius=20,
              popup = name +  " Line(s): " + entrance,
              color="cyan",
              fill=True,
              fill_color="#1e81b0").add_to(m)
    #clicking on the circle display a popup with the name of the entrance and the lines that pass through its station

m.save("site.html") #save the results in a .html file

#pdf = pd.DataFrame(data=BBB)
#pdf.to_csv("points.csv",index = False)
#used for exporting which stations which lines go through to edit the .csv files since the points for PolyLine need to be in the perfect order to display the subway lines properly.